Query performance benchmark in .NET 8
This post demonstrates the benchmarks of the different query approaches in C# .NET 8 using the AdventureWorks2022 database. It compares the performance of the following query types:
- Entity Framework (EF) Queries
- Raw SQL
- Stored Procedures (SP)
- Dapper
Introduction
In this post I will walk you through my benchmarking project which evaluates the performance of various querying techniques in C# .NET 8 using the AdventureWorks2022 database. The goal is to understand how different querying methods such as Entity Framework (EF) Queries, Raw SQL, Stored Procedures (SP), and Dapper perform in terms of speed and efficiency.
This project uses design patterns and technologies like MediatR, Dependency Injection (DI), Minimal APIs, Blazor, RabbitMQ and SQL Server.
For the full source code, you can visit the GitHub repository: AdventureWorks2022-Query-Performance-Benchmarking.
What Am I Testing?
The main focus of this test is to measure how long it takes to execute different types of queries on the AdventureWorks2022 database. Each query method has its own trade-offs in terms of complexity and performance which I aim to demonstrate with this benchmark.
The queries I am benchmarking include:
- Entity Framework Core (EF) Queries – Uses LINQ and leverages EF for database interaction.
- Raw SQL Queries – Executes raw SQL through from sql raw methods.
- Stored Procedures – Executes T-SQL procedures directly from C#.
- Dapper – A micro ORM known for lightweight performance in handling SQL queries.
How I am Planning to Test It
I have created a console application that runs each query sequentially, logs the execution time and publishes the results via RabbitMQ. These results are then displayed on a Blazor WebApp which interacts with an API.
Before each test run I execute a set of commands to clear SQL Server’s cache to avoid any benefits from query caching. The queries are run against the following tables in AdventureWorks2022:
- Sales.SalesOrderHeader
- Sales.SalesOrderDetail
- Sales.Customer
- Production.Product
- dbo.LargeDataTest
- dbo.LargeDataTestWithIndex
Queries that will be tested
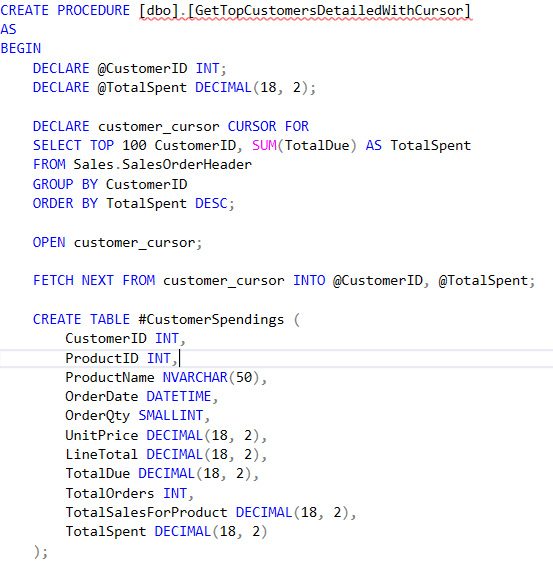
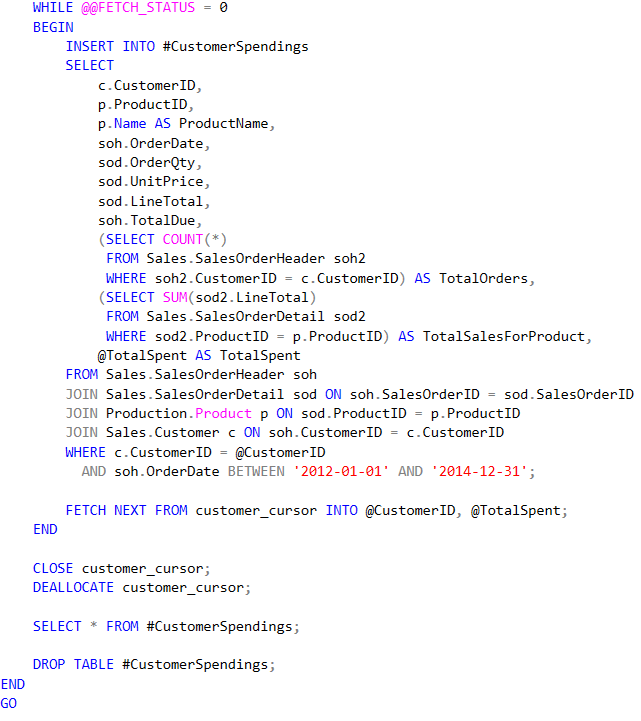
GetTopCustomersDetailedWithCursor
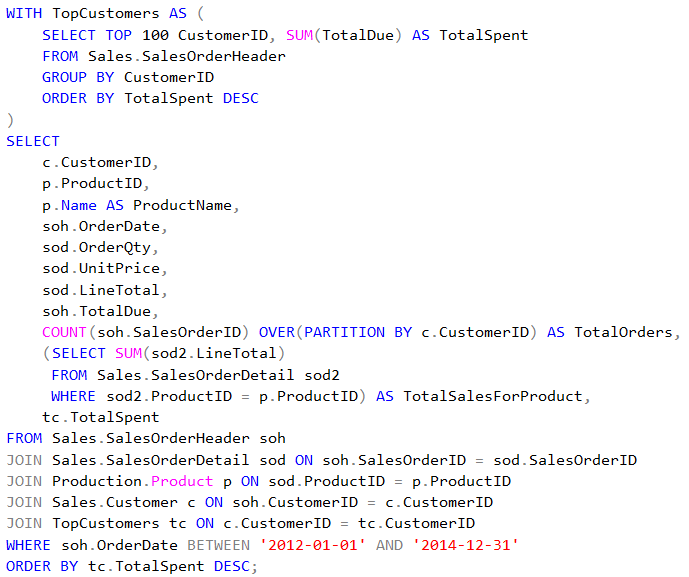
GetTopCustomersDetailed
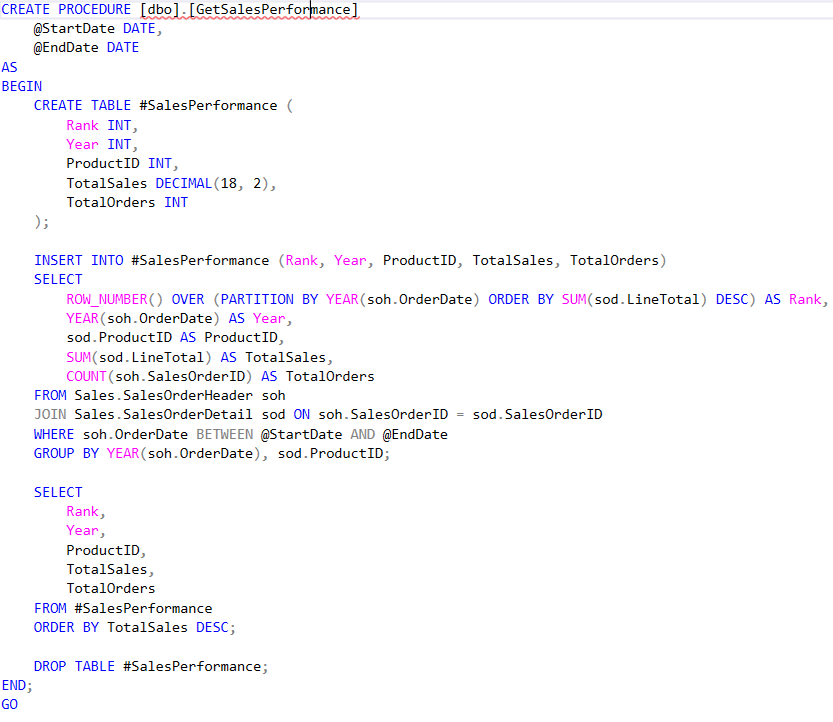
GetSalesPerformance
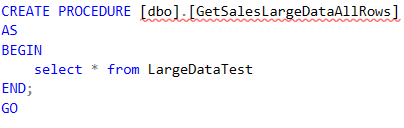
GetSalesLargeDataAllRows
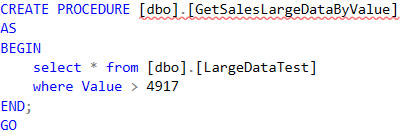
GetSalesLargeDataByValue
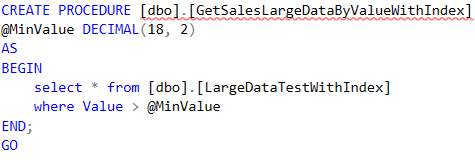
GetSalesLargeDataByValueWithIndex
Number of rows per query
| Query | Number of rows |
|---|---|
| GetTopCustomersDetailed | 27911 |
| GetSalesPerformance | 550 |
| GetSalesLargeDataAllRows | 15 000 000 |
| GetSalesLargeDataByValue | 469 123 |
| GetSalesLargeDataByValueWithIndex (value | 469 123 |
| GetSalesLargeDataByValueWithIndex (value 1000) | 4 003 054 |
Commands to Clear SQL Server Cache
To ensure consistent performance testing, I run the following commands before each query:
DBCC DROPCLEANBUFFERS;
DBCC FREEPROCCACHE;
These commands help prevent query caching and allow for accurate benchmarking.
Technologies and Design Patterns Used
Key Technologies
- .NET 8: The latest version of .NET used across all components.
- SQL Server: The relational database hosting the AdventureWorks2022 schema.
- Blazor: Used to display query results in real-time.
- RabbitMQ: A message broker that handles communication between the console application and the web app.
- Docker: Used to containerize SQL Server and RabbitMQ for easy setup.
Design Patterns
- MediatR: Handles the query logic, making the application’s architecture more maintainable
- Adapter Pattern: This is used between the API and the console app to decouple the implementation of the query performance logic.
- Dependency Injection (DI): Helps manage services in a loosely coupled manner making it easy to replace services during testing.
- Minimal API: The API that triggers query runs is built using .NET 8’s Minimal API pattern allowing for simplicity and performance.
Console Application Design
The console application (AdventureWorksQueryPerformance) is the core of this project. It does the heavy lifting by:
- Executing queries sequentially.
- Measuring the execution time.
- Generating HTML reports with bar charts for performance visualization.
- Publishing query results to RabbitMQ in real-time for the web app to consume.
Here’s an example of how the query results are structured:
public class TaskResult
{
    public string TaskName { get; set; }
    public long ElapsedMilliseconds { get; set; }
}
The console application is designed to be simple and efficient, running each test and logging results.
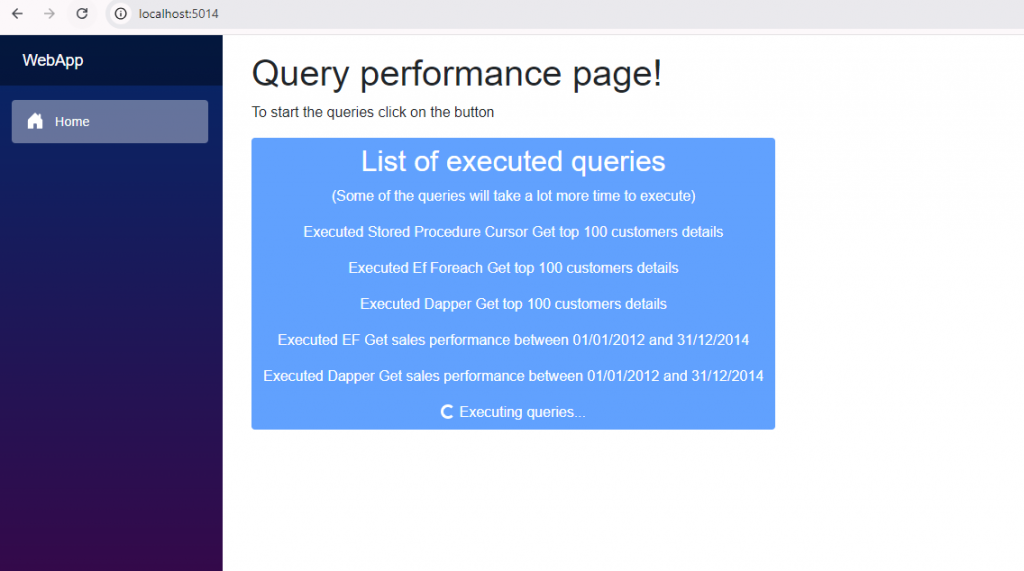
WebApp and API Interaction
The Blazor WebApp provides a interface to view the query performance results. Here is how it works:
- The WebApp fetches messages from RabbitMQ that contain queries names that executed.
- Query execution is triggered by sending a request to the AdventureWorksQueryPerformanceAPI which communicates with the console app using an adapter pattern.
- Once the console app finishes running the queries it returns the results to the WebApp which displays the results in a table format.
The API (AdventureWorksQueryPerformanceAPI) is responsible for exposing an endpoint (/run-queries) that triggers the console app to execute the queries and return the results.
Query Performance Results
The results of the benchmark are presented in an HTML file with a bar chart comparing the execution times for each query type.
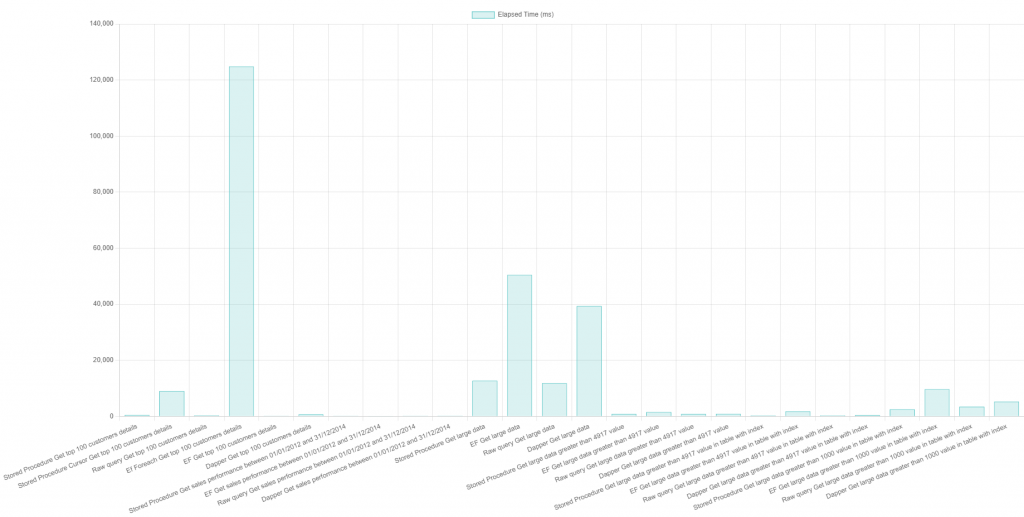
Here’s a sample of what the results look like (you can visualize this in the Blazor WebApp):
| Task Name | Elapsed Milliseconds |
|---|---|
| Stored Procedure Get top 100 customers details | 310 |
| Stored Procedure Cursor Get top 100 customers details | 6624 |
| Raw query Get top 100 customers details | 280 |
| Ef Foreach Get top 100 customers details | 78431 |
| EF Get top 100 customers details | 57 |
| Dapper Get top 100 customers details | 454 |
| Stored Procedure Get sales performance between 01/01/2012 and 31/12/2014 | 122 |
| EF Get sales performance between 01/01/2012 and 31/12/2014 | 14 |
| Raw query Get sales performance between 01/01/2012 and 31/12/2014 | 116 |
| Dapper Get sales performance between 01/01/2012 and 31/12/2014 | 131 |
| Stored Procedure Get large data | 8624 |
| EF Get large data | 27085 |
| Raw query Get large data | 8541 |
| Dapper Get large data | 16815 |
| Stored Procedure Get large data greater than 4917 value | 866 |
| EF Get large data greater than 4917 value | 1112 |
| Raw query Get large data greater than 4917 value | 882 |
| Dapper Get large data greater than 4917 value | 866 |
| Stored Procedure Get large data greater than 4917 value in table with index | 318 |
| EF Get large data greater than 4917 value in table with index | 453 |
| Raw query Get large data greater than 4917 value in table with index | 284 |
| Dapper Get large data greater than 4917 value in table with index | 292 |
| Stored Procedure Get large data greater than 1000 value in table with index | 2305 |
| EF Get large data greater than 1000 value in table with index | 3053 |
| Raw query Get large data greater than 1000 value in table with index | 2225 |
| Dapper Get large data greater than 1000 value in table with index | 3041 |
These results can vary depending on system hardware specifications and database load but they give a good sense of how each method performs under similar conditions.
Explanation of Results
EF Foreach Get top 100 Customers Details: Why Is It Slow?
When using a foreach loop in Entity Framework to fetch data, the code typically looks something like this:
foreach (var customer in topCustomers)
{
    var customerDetails = await _dbContext.CustomerDetails
                                          .Where(cd => cd.CustomerId == customer.Id)
                                          .ToListAsync();
}
In this example:
- First the application queries for the top 100 customers
- Then for each customer it performs a separate database query to fetch the customer’s details
This means 100 individual queries are executed one for each customer. Executing queries in a loop like this introduces the following inefficiencies:
- N+1 Problem: In this case, the N+1 problem occurs because for each of the top 100 customers (N), there is an additional query (1) executed to retrieve customer details. This leads to unnecessary round trips to the database which drastically slows down execution.
- Database Latency: Each query incurs the overhead of establishing a connection with the database, executing the query, and returning the results. When done repeatedly in a loop, these operations add up, leading to significant performance degradation.
- Lack of Query Optimization: Entity Framework (EF) is optimized for working with sets of data, not individual queries inside loops. By fetching data in a loop you are not leveraging the power of EF’s ability to generate optimized SQL for bulk operations.
Comparison with Cursor based Query
The inefficiencies of the foreach loop are similar to those of a cursor-based query in SQL. In the benchmark results, the Stored Procedure Cursor Get top 100 customers details query takes significantly longer than the non cursor version (6624 ms vs. 310 ms). This is because:
- Row-by-Row Processing: Cursors in SQL process data row by row, which is akin to the foreach loop in C#. Instead of fetching data in bulk, the cursor iterates over each row and processes it individually. This approach is generally slower because it prevents the database engine from optimizing the query execution as a set based operation.
- Higher Overhead: Like the foreach loop, each iteration in a cursor incurs overhead in terms of locking, latching and resource management in the database. The database engine has to maintain the cursor’s state between iterations adding to the overall processing time.
Stored Procedure vs. EF Queries
- Stored Procedure Get top 100 customers details: 310 ms
- EF Get top 100 customers details: 57 ms
- Raw query Get top 100 customers details: 280 ms
- Dapper Get top 100 customers details: 454 ms
The stored procedure performs reasonably well at 310 ms, but Entity Framework (EF) performs the best at 57 ms. Raw SQL comes in slightly slower at 280 ms, while Dapper, though faster than the stored procedure, is less efficient than both EF and raw SQL in this case. This may indicate that EF is optimized for this specific query, possibly due to query caching or optimizations in its execution plan
Cursor vs. Non-Cursor Stored Procedures
- Stored Procedure Cursor Get top 100 customers details: 6624 ms
- Stored Procedure Get top 100 customers details: 310 ms
The cursor-based stored procedure is significantly slower, taking over 6 seconds compared to 310 ms for the standard stored procedure. This highlights the performance overhead associated with using cursors, which generally require more processing time due to their row-by-row processing nature
Performance of Large Data Queries
- Stored Procedure Get large data: 8624 ms
- EF Get large data: 27085 ms
- Raw query Get large data: 8541 ms
- Dapper Get large data: 16815 ms
In querying large data sets, the stored procedure remains efficient at 8624 ms, while EF takes considerably longer at 27085 ms. The raw query is competitive at 8541 ms, indicating that it is optimized well for large data retrieval. Dapper, while faster than EF, does not match the efficiency of the stored procedure or raw SQL in this scenario
Performance Based on Conditions
For queries that filter on data values (e.g., Get large data greater than 4917 value), the stored procedures consistently perform better than EF and Dapper. This performance trend indicates that stored procedures are better optimized for complex data retrieval operations
Effect of Indexing
Queries that specify conditions with indexing (e.g., Get large data greater than 4917 value in table with index) show performance improvements, particularly in the stored procedure’s execution time (318 ms). This suggests that the database is effectively utilizing indexes to speed up data access which is crucial for performance when dealing with large datasets
Conclusion
This benchmarking project provides insights into how fast different query techniques perform. While Entity Framework offers ease of use and flexibility, direct SQL queries (Raw SQL, Stored Procedures, Dapper) often outperform EF when it comes to raw performance.
Overall, the results demonstrate that:
- Stored procedures are generally the fastest option for complex queries and large datasets, especially when leveraging indexing.
- Entity Framework can be very efficient for simpler queries but may lag when handling larger datasets or more complex queries.
- Raw SQL provides good performance and is comparable to stored procedures especially for large data queries.
- Dapper offers decent performance but is usually not as optimized as stored procedures or raw SQL for complex queries, though it can be beneficial for its simplicity and ease of use in .NET applications.
For those interested, the full code and setup instructions can be found on GitHub.
Feel free to clone the repository, run the benchmarks yourself, and contribute any improvements!
Future Enhancements
- Use SQL Profiler to analyze queries and query plans
- Analyze dapper and EF query plans and introduce potential improvements
- Analyze memory consumption for each query method
- Experiment with parallel query execution
- Execute queries without clear SQL server cache methods
You can clone repository by clicking on the Github icon: